
Application events
What happened to your application's resources: failing healthchecks, restarts, out-of-memory kills, crash loops, cron runs and deployments
Granite watches every resource of your application and records what happens to it: a healthcheck starts failing, a container runs out of memory or keeps crashing, an image cannot be pulled, a cron run fails, a deployment finishes. These events are shown on the Events tab of the application and kept for 30 days.
The same events can be delivered to your own endpoint with webhooks and are emailed to the project’s contact email as alert emails.
Where to find them
Open the application and switch to the Events tab. The newest events are at the top; the list refreshes every 30 seconds.
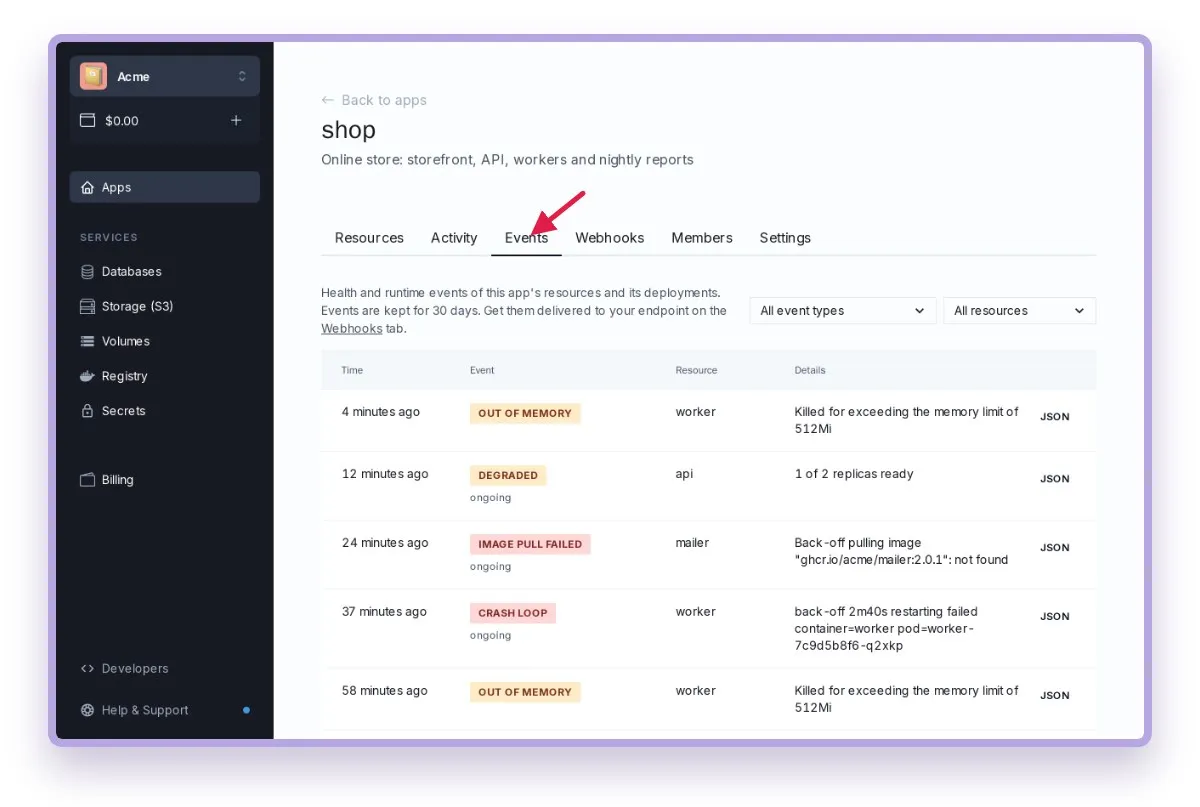
ongoing under an event means the problem is still open — for example, the resource is still down. The CLI marks it (ongoing).
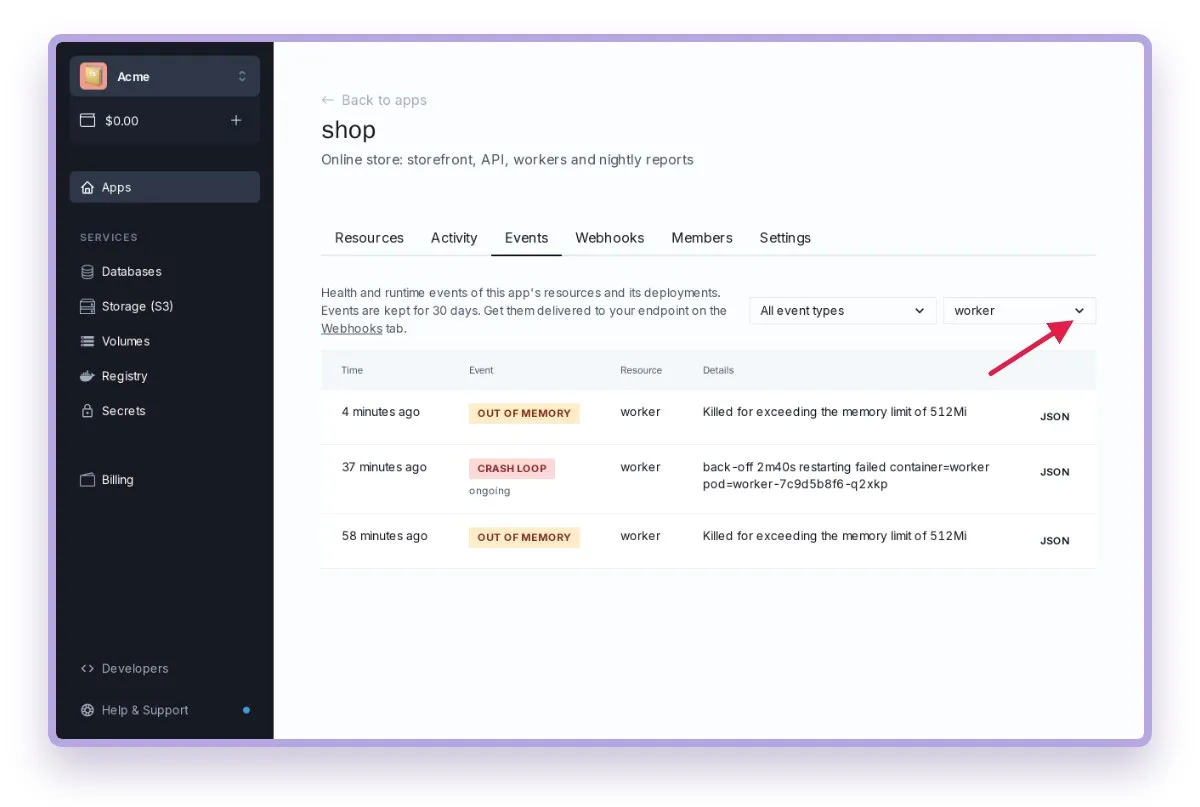
Use the two selectors above the list to show only one event type or one resource:
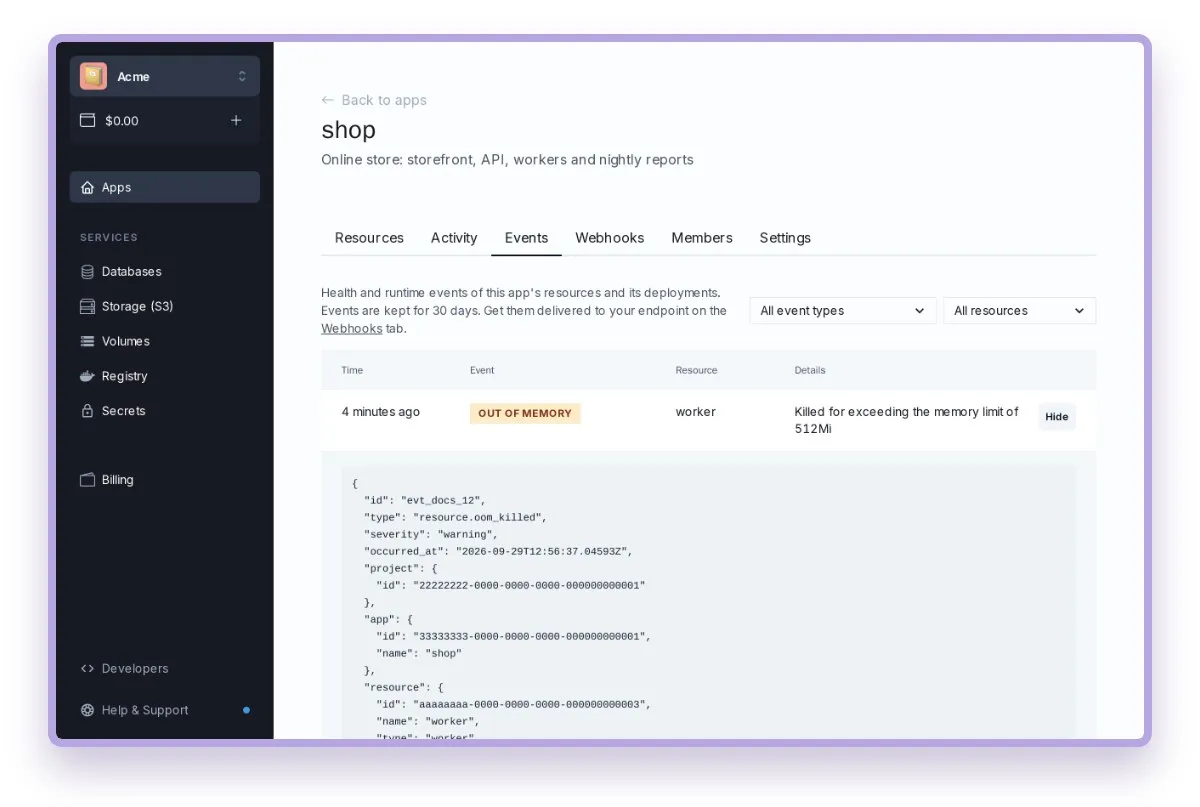
JSON shows the full event, exactly as a webhook receives it:
Problems and recoveries
Most problems come in pairs: an event when the problem starts and another when it is over. Granite waits a little before reporting both, so a short blip does not raise an alert: a problem is reported after it has lasted about 30 seconds (60 seconds for Down and Degraded), a recovery after the resource has been healthy for 2 minutes.
| Event | Type | When |
|---|---|---|
| Healthcheck failing | resource.healthcheck.failing |
The healthcheck of a running container keeps failing. The details show the probe’s own message, e.g. HTTP probe failed with statuscode: 503. |
| Healthcheck recovered | resource.healthcheck.recovered |
The healthcheck passes again. |
| Down | resource.down |
No replica of a web app or worker is ready. |
| Degraded | resource.degraded |
Some replicas are not ready. |
| Up | resource.up |
All replicas are ready again. |
| Crash loop | resource.crash_loop |
A container keeps crashing and Kubernetes is waiting before the next restart (CrashLoopBackOff). |
| Crash loop resolved | resource.crash_loop.recovered |
The container stopped crashing. |
| Image pull failed | resource.image_pull_failed |
The container image cannot be pulled: a missing tag, a private image without credentials, expired registry credentials. |
| Image pull recovered | resource.image_pull_failed.recovered |
The image is pulled again. |
| Configuration error | resource.config_error |
The container cannot be created or started because of its configuration, e.g. a command that does not exist. |
| Configuration error resolved | resource.config_error.recovered |
The container starts again. |
Single events
| Event | Type | When |
|---|---|---|
| Restarted | resource.restarted |
A container was restarted. The reason tells why: the liveness probe failed, the process exited with an error, or it exited normally. At most one event per resource every 5 minutes; the rest are counted in restarts_in_window. |
| Out of memory | resource.oom_killed |
A container was killed for using more memory than its limit. Raise the replica size or reduce memory usage. |
| Cron run failed | cronjob.run.failed |
A cron job run failed, with the exit code of the last attempt. |
| Cron run succeeded | cronjob.run.succeeded |
A cron job run finished successfully. |
| Cron run too long | cronjob.run.long_running |
A cron job run is still going when the next one is due (at least 5 minutes). |
| Deployment started | deployment.started |
A deployment started building or rolling out. |
| Deployment succeeded | deployment.succeeded |
A deployment finished. |
| Deployment failed | deployment.failed |
A deployment failed, with the reason. |
| Deployment canceled | deployment.canceled |
A deployment was canceled. |
| Build failed | build.failed |
Building an image from source failed. |
While a deployment is rolling out, Granite does not report the health of its new containers: a new version that does not start is reported once, as Deployment failed.
The event object
{ "id": "evt_5f0c3a1e9b7d42c8a6e1f0b3c4d5e6f7", "type": "resource.healthcheck.failing", "severity": "warning", "occurred_at": "2026-09-28T13:39:24Z", "project": {"id": "22222222-…"}, "app": {"id": "33333333-…", "name": "shop"}, "resource": {"id": "aaaaaaaa-…", "name": "web", "type": "web-app"}, "incident": { "id": "7b2eec67-…", "kind": "healthcheck", "status": "open", "opened_at": "2026-09-28T13:39:24Z" }, "data": { "message": "Readiness probe failed: HTTP probe failed with statuscode: 503", "probe": {"type": "http", "path": "/health", "port": "8080"}, "pods_failing": 2, "pods_total": 2 }}severity—info,warningorcritical.occurred_at— when the problem started or ended, not when it was reported.resource—nullfor events of the whole application, e.g. redeploying all resources at once.incident— present on problems and recoveries; the opening and closing events share itsid.data— depends on the type: probe message, exit code, memory limit, cron job name, deployment reason.
From the CLI and the API
novps apps events <app_id> # the latest events, oldest firstnovps apps events <app_id> -f # keep printing new eventsnovps apps events <app_id> --since 6h -r web # one resource, last 6 hoursnovps apps events <app_id> --json # for scriptsSee novps apps events for every option. The CLI uses the public API, which you can call with a personal access token:
curl -H "Authorization: $GRANITE_TOKEN" \ "https://api.granite.so/apps/<app_id>/events?type=resource.down&since=2026-09-28T00:00:00Z"Query parameters: page, type, resource_id, since (RFC 3339). Events are returned newest first, 25 per page, with count and page_limit.